Drone-Data-in-Agricultural-Research
Multispectral Data Extraction (low throughput)
This lesson builds on the content and setup done in Multispectral Data Visualization.
Learning Objectives
- Create a shapefile layer manually
- Edit the features and data of a shapefile layer
- Use a shapefile layer to extract data from a raster image
1. Create a new shapefile layer
A shapefile layer (in this case) will be a set of polygons that define the area of interest.
- To create a new shapefile layer navigate to
Layer»Create Layer»New Shapefile Layer... - Name and save the file
- Select
Polygonfor the geometry type - Set the coordinate reference system (CRS) to match the CRS of the multispectral image
- Click
OKto save the blank shapefile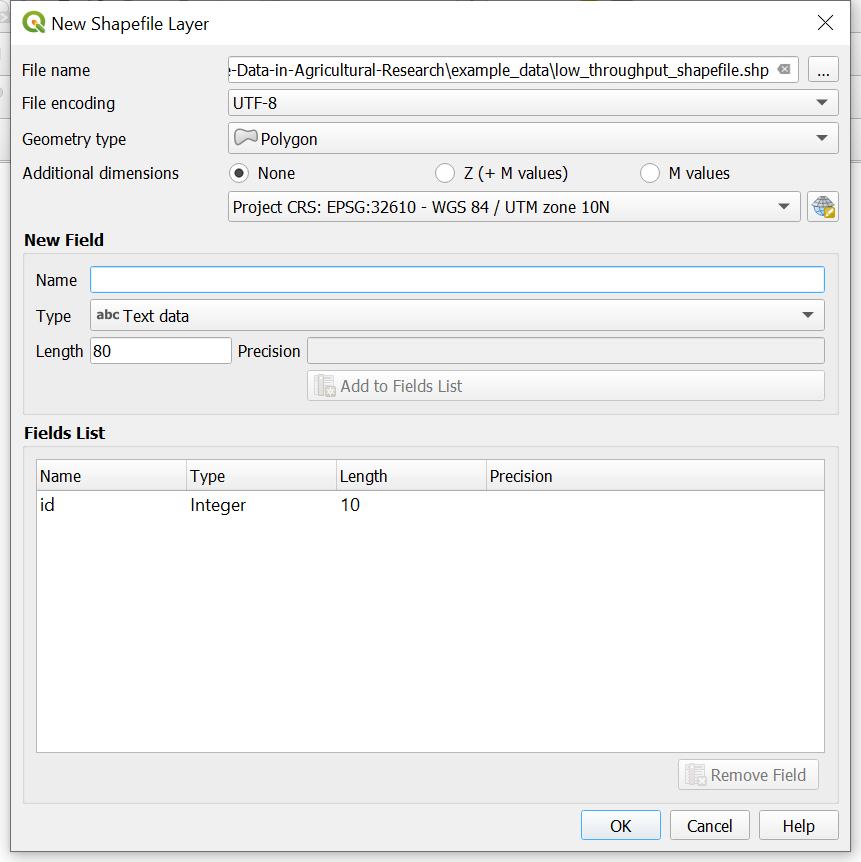
Check-in
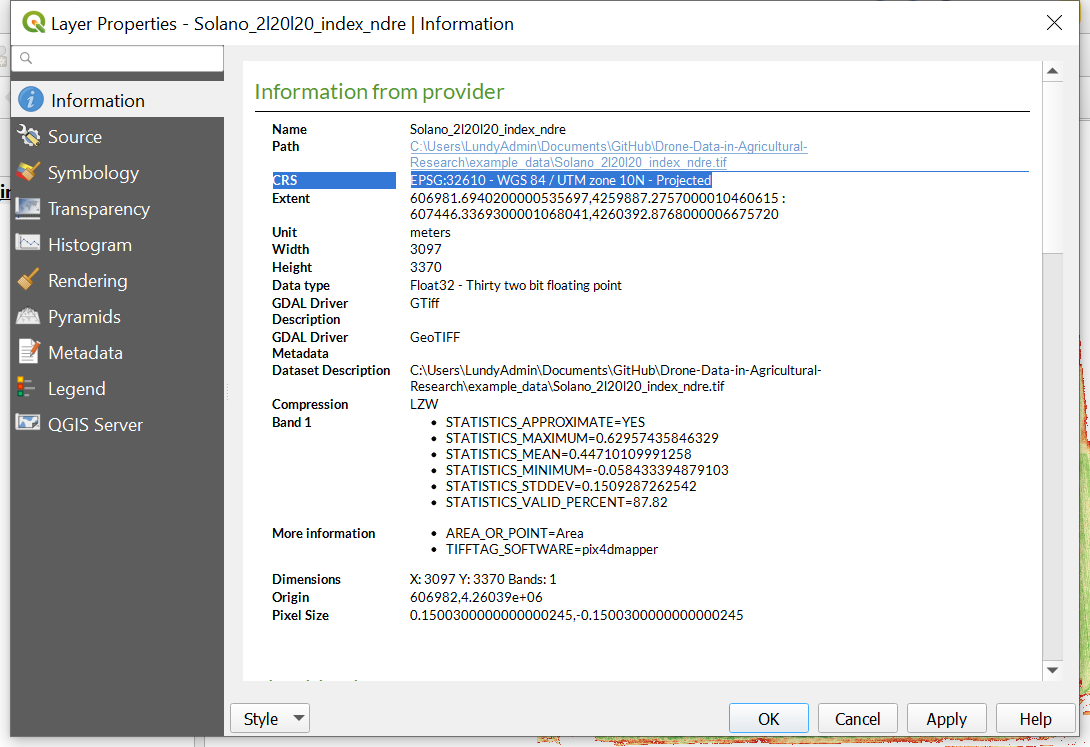
The coordinate reference system (CRS) of the image and the shapefile must match not only for accuracy but also to be able to perform functions such as extracting data. To check the CRS of the raster layer right click on the raster layer Solano_2l20l20_index_ndre and navigate to
Properties.... In theImage Propertieswindow under theInformationtab look for CRS (it should be 3rd from the top). The EPSG number displayed is a unique number for each CRS. in the case of the Solano_2l20l20_index_ndre layer the CRS is EPSG:32610 - WGS 84 / UTM zone 10N - Projected. A UTM projection has a unit of meters. This is also shown in the layer information.
Check-in
If the
Digitizing Toolbarand/orAdvanced Digitizing Toolbaris not visible turn it on by navigating toView»Toolbars»Digitizing Toolbarand/orView»Toolbars»Advanced Digitizing Toolbar
2. Create a features in the shapefile
- Toggle editing on by right clicking the shapefile layer then selecting the yellow pencil
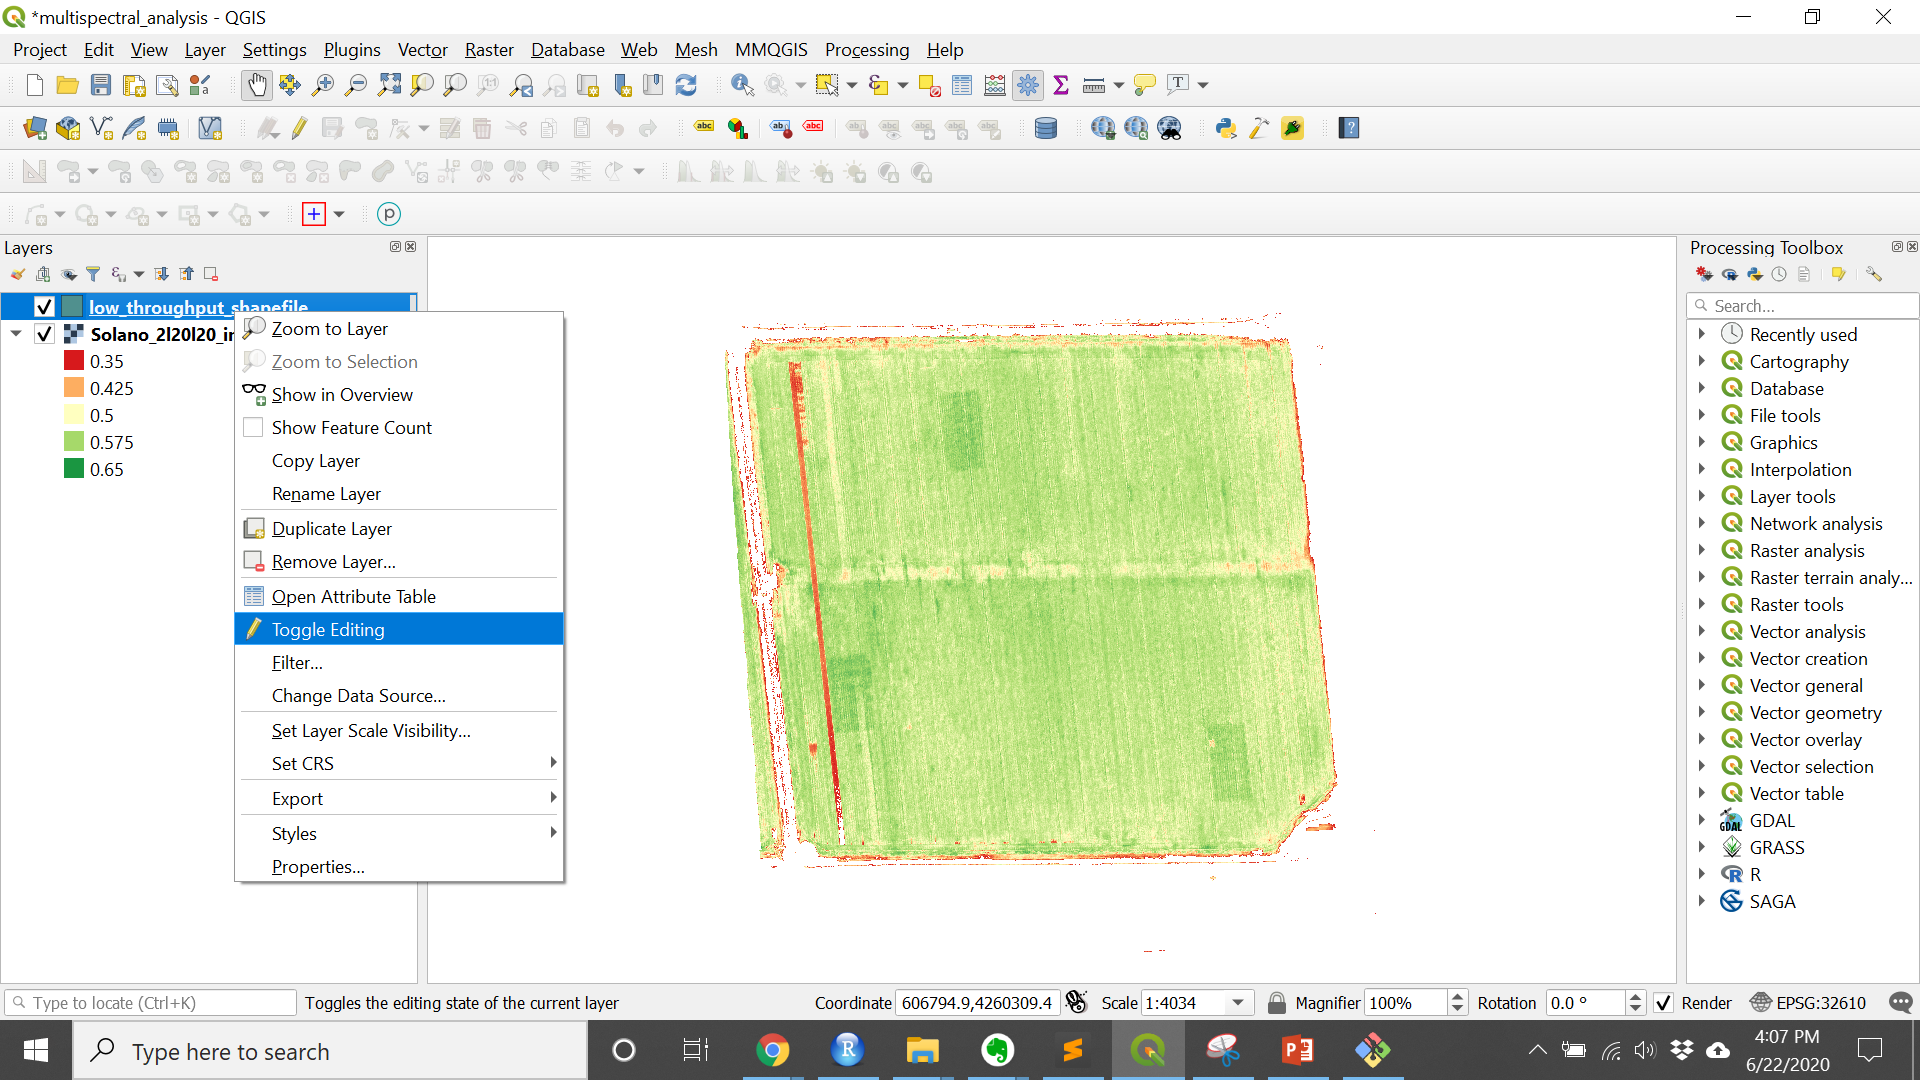
- Add a feature by clicking
Add Polygon Featurein theDigitizing Toolbar(Ctrl + .)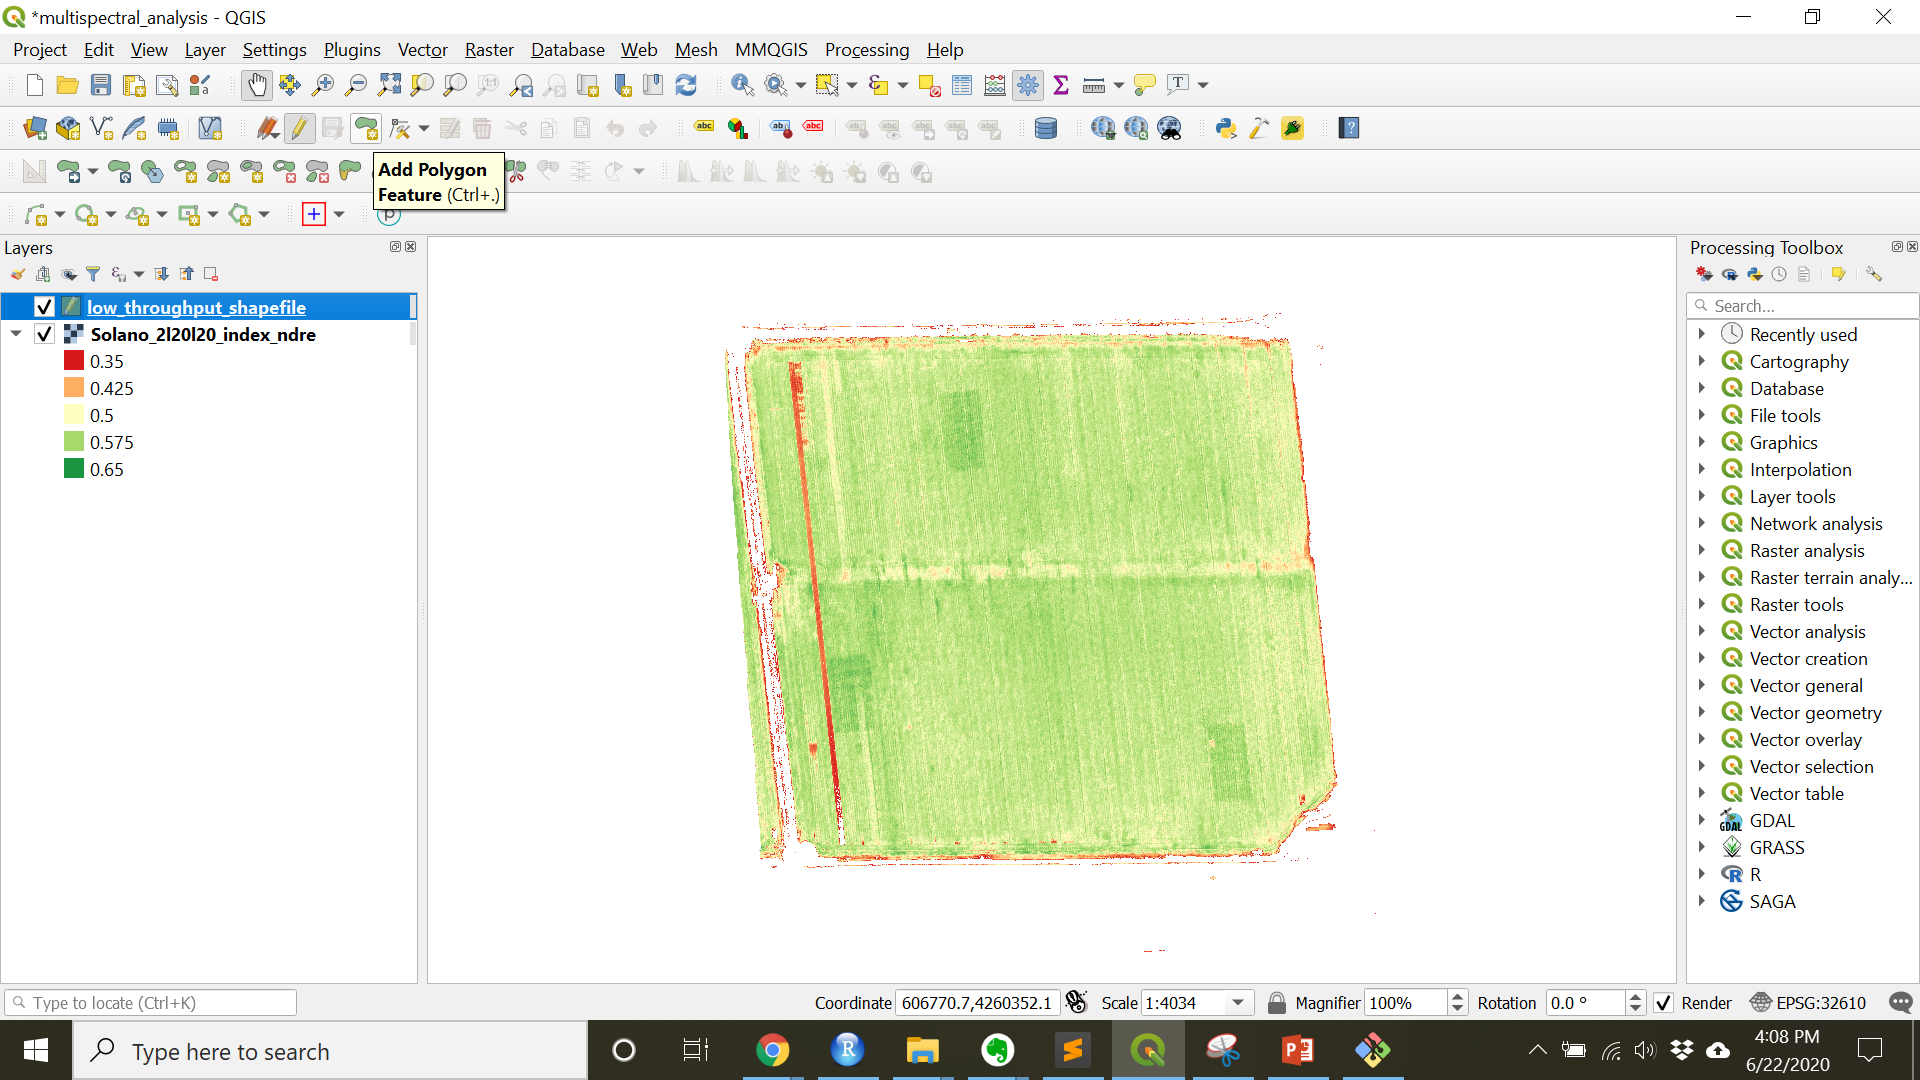
- Using the courser draw the outline of the area of interest. Each left click creates a node of a polygon and a right click closes the polygon.
- Set the ID of the polygon by entering an integer into the pop-up window when prompted.
- Repeat for each area of interest.
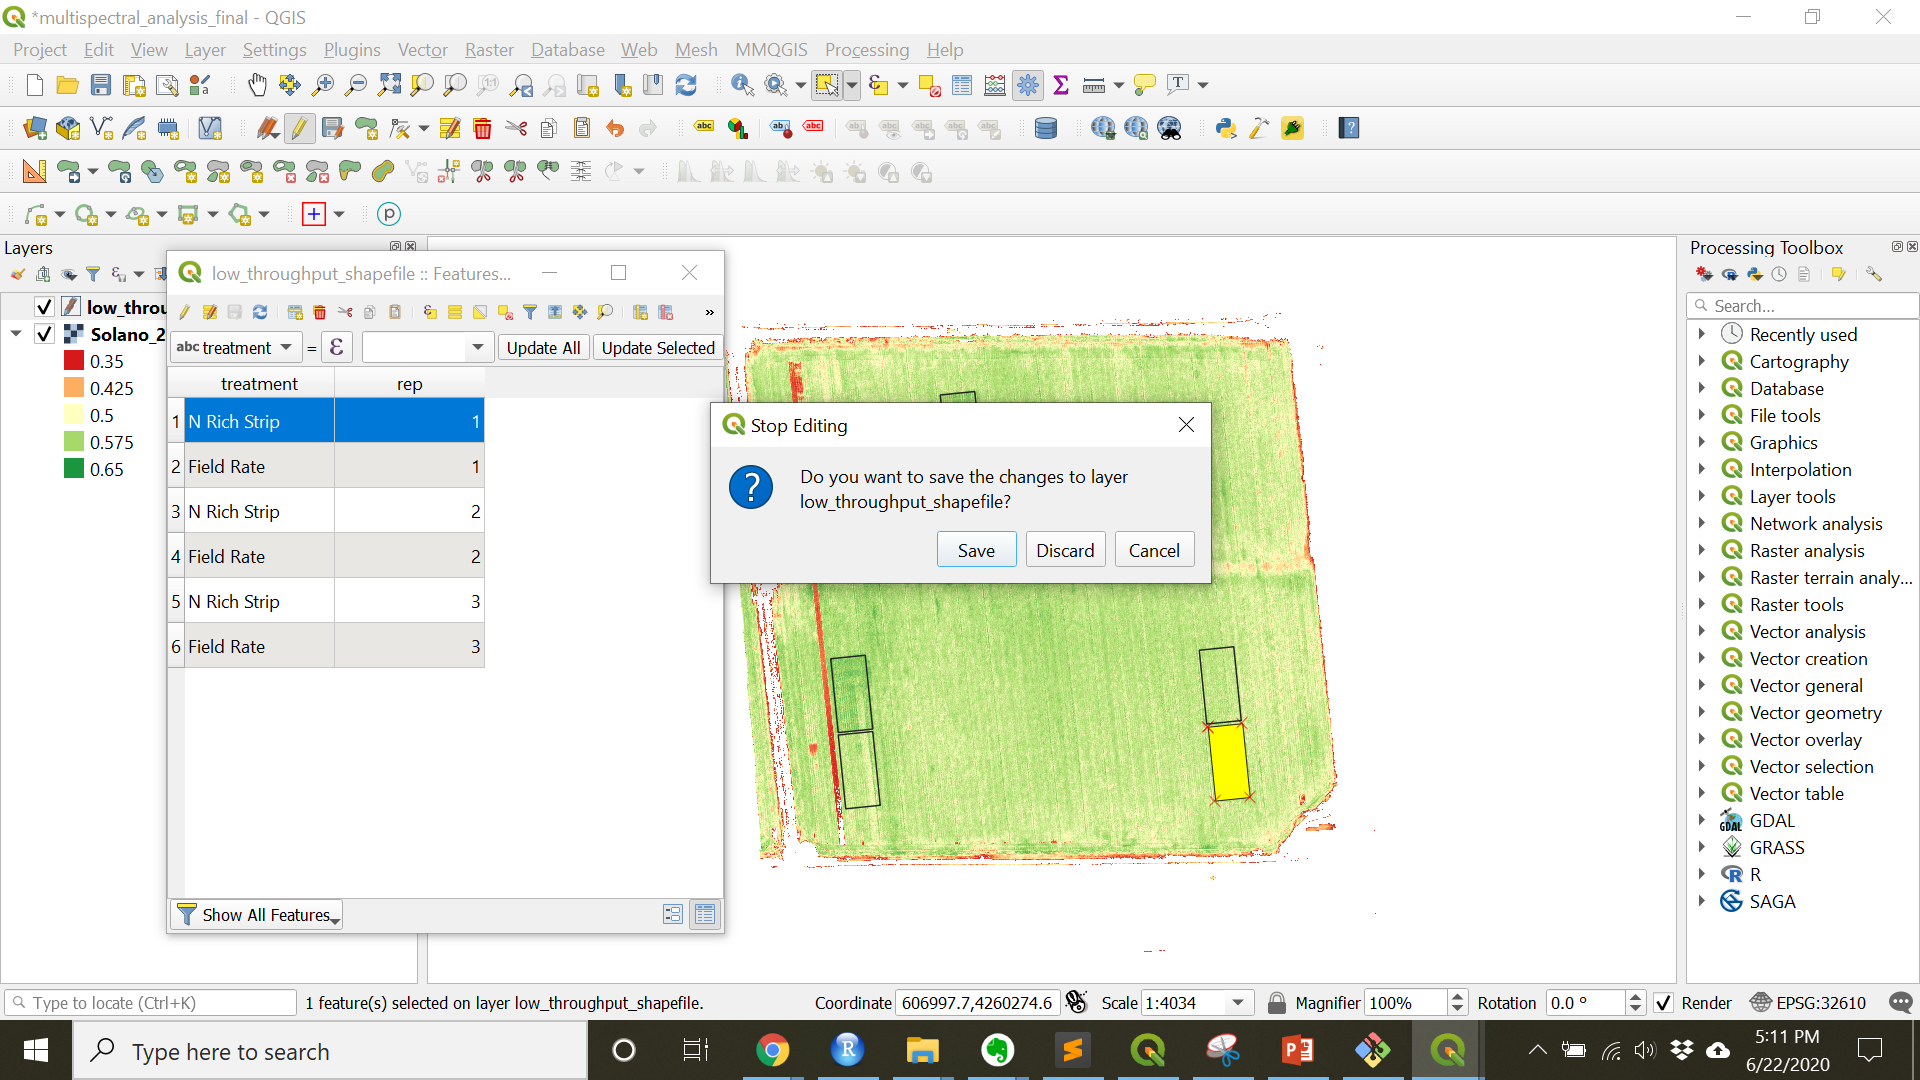
- End the edit session by again clicking the
Toggle editingbutton (yellow pencil) - Save the edits when prompted.
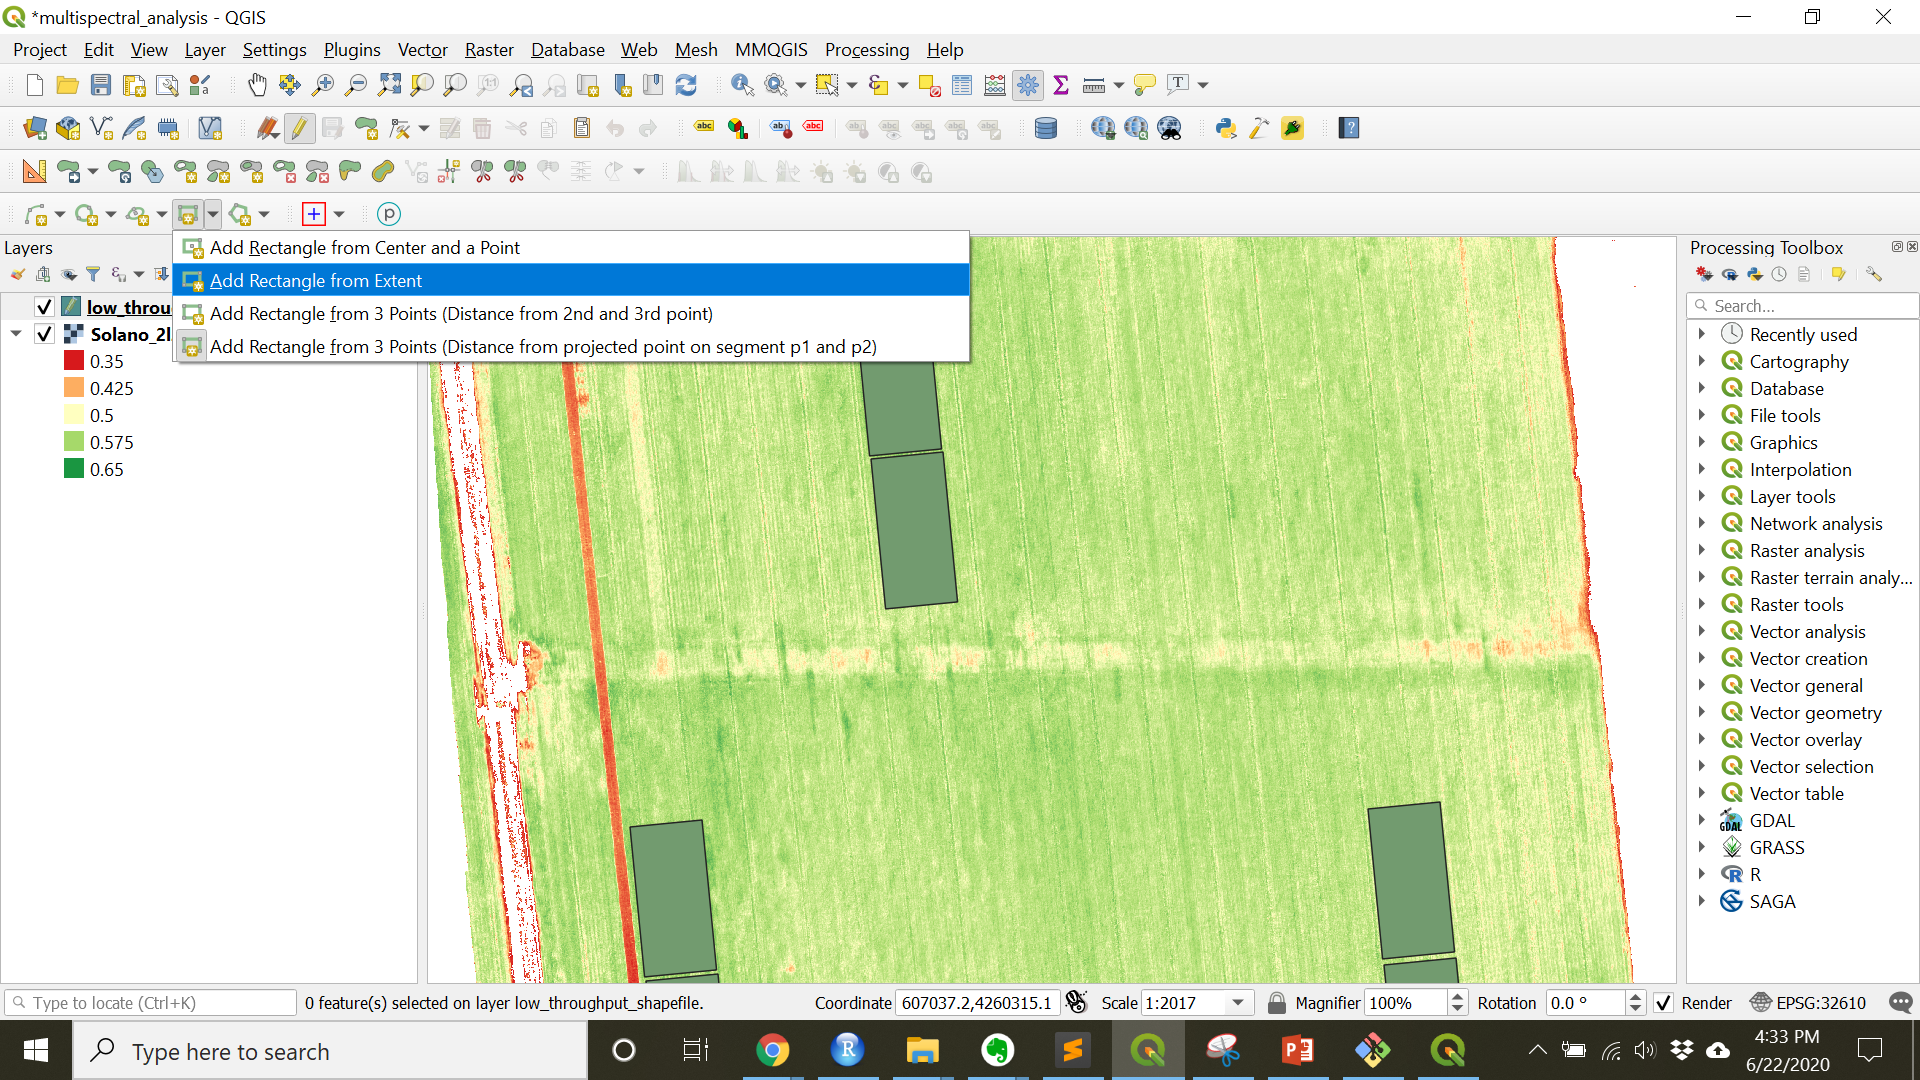
Another way to create features
Rectangular features can also be created using the
Shape Digitizing Toolbar. If theShape Digitizing Toolbaris not visible turn it on by navigating toView»Toolbars»Shape Digitizing Toolbar. Use theAdd rectangle from 3 pointstool, choosingAdd Rectangle from 3 Points (Distance from 2nd and 3rd point).
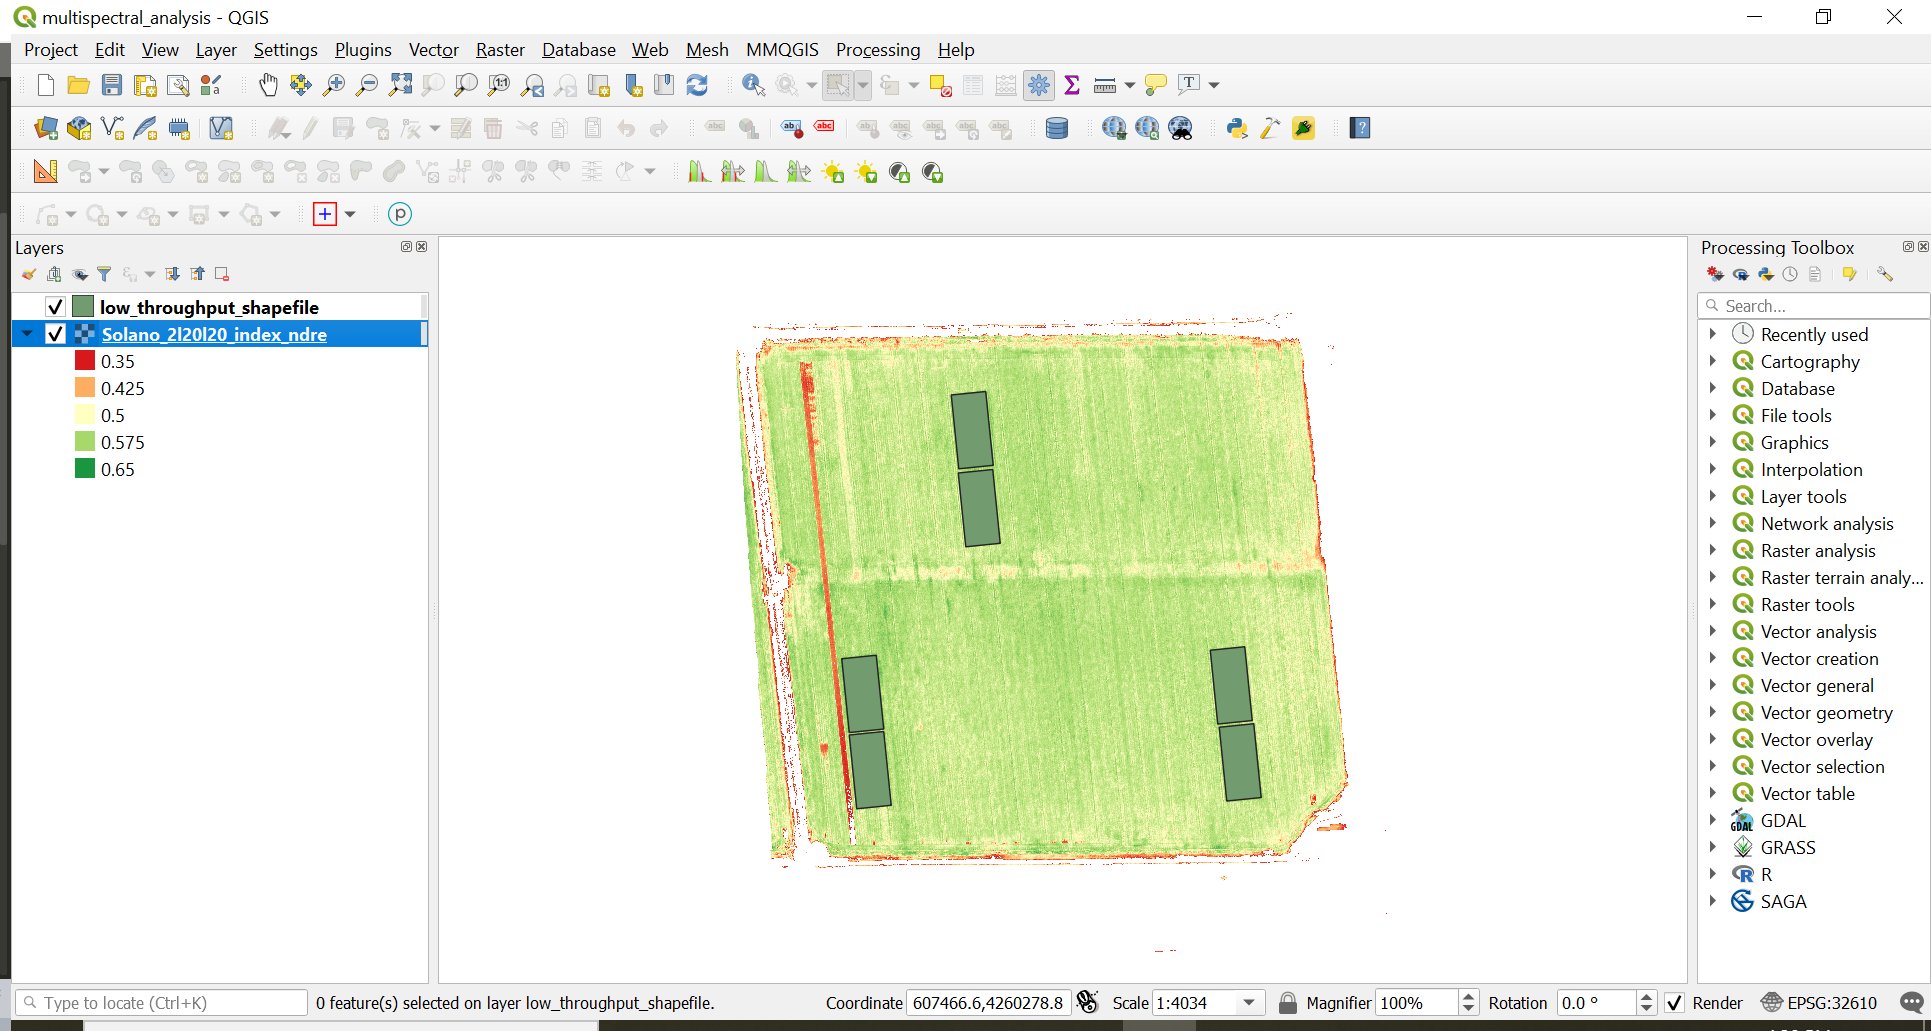
Check-in
The areas of interest in this example are the areas of the field where a higher amount of N fertilizer were added in order to determine if the field would response to an in-season fertilization (see image below).
3. Edit the shapefile
If a shapefile needs to be copied, moved, or resized it can be done!
- With
Toggle Editingon, highlight the shapefile in theLayerspanel. - In the
Attributes ToolbarclickSelect Features by area or single click. - Select the feature(s) that need to be edited by clicking or drawing a box to select.
- In the
Digitizing Toolbar,- the
Vertex Toolallows the user to move the vertices’s of a feature - the
Copy Feature(Ctrl + C) button copies the selected feature(s) - the
Paste Feature(Ctrl + V) button pastes the selected features(s) over the current features - the
Delete Selectedbutton, does exactly what is implies
- the
- In the
Advanced Digitizing Toolbar,- choose
Move Feature(s)the click and drag the feature(s) to their new location
- choose
As long as the edits are not saved, Edit » Undo (Ctrl + Z) works.
4. Add metadata to the shapefile
- Toggle editing on for the shapefile that was just created.
- Open the
Attribute Tableby right clicking the shapefile layer and choosingOpen Attribute Table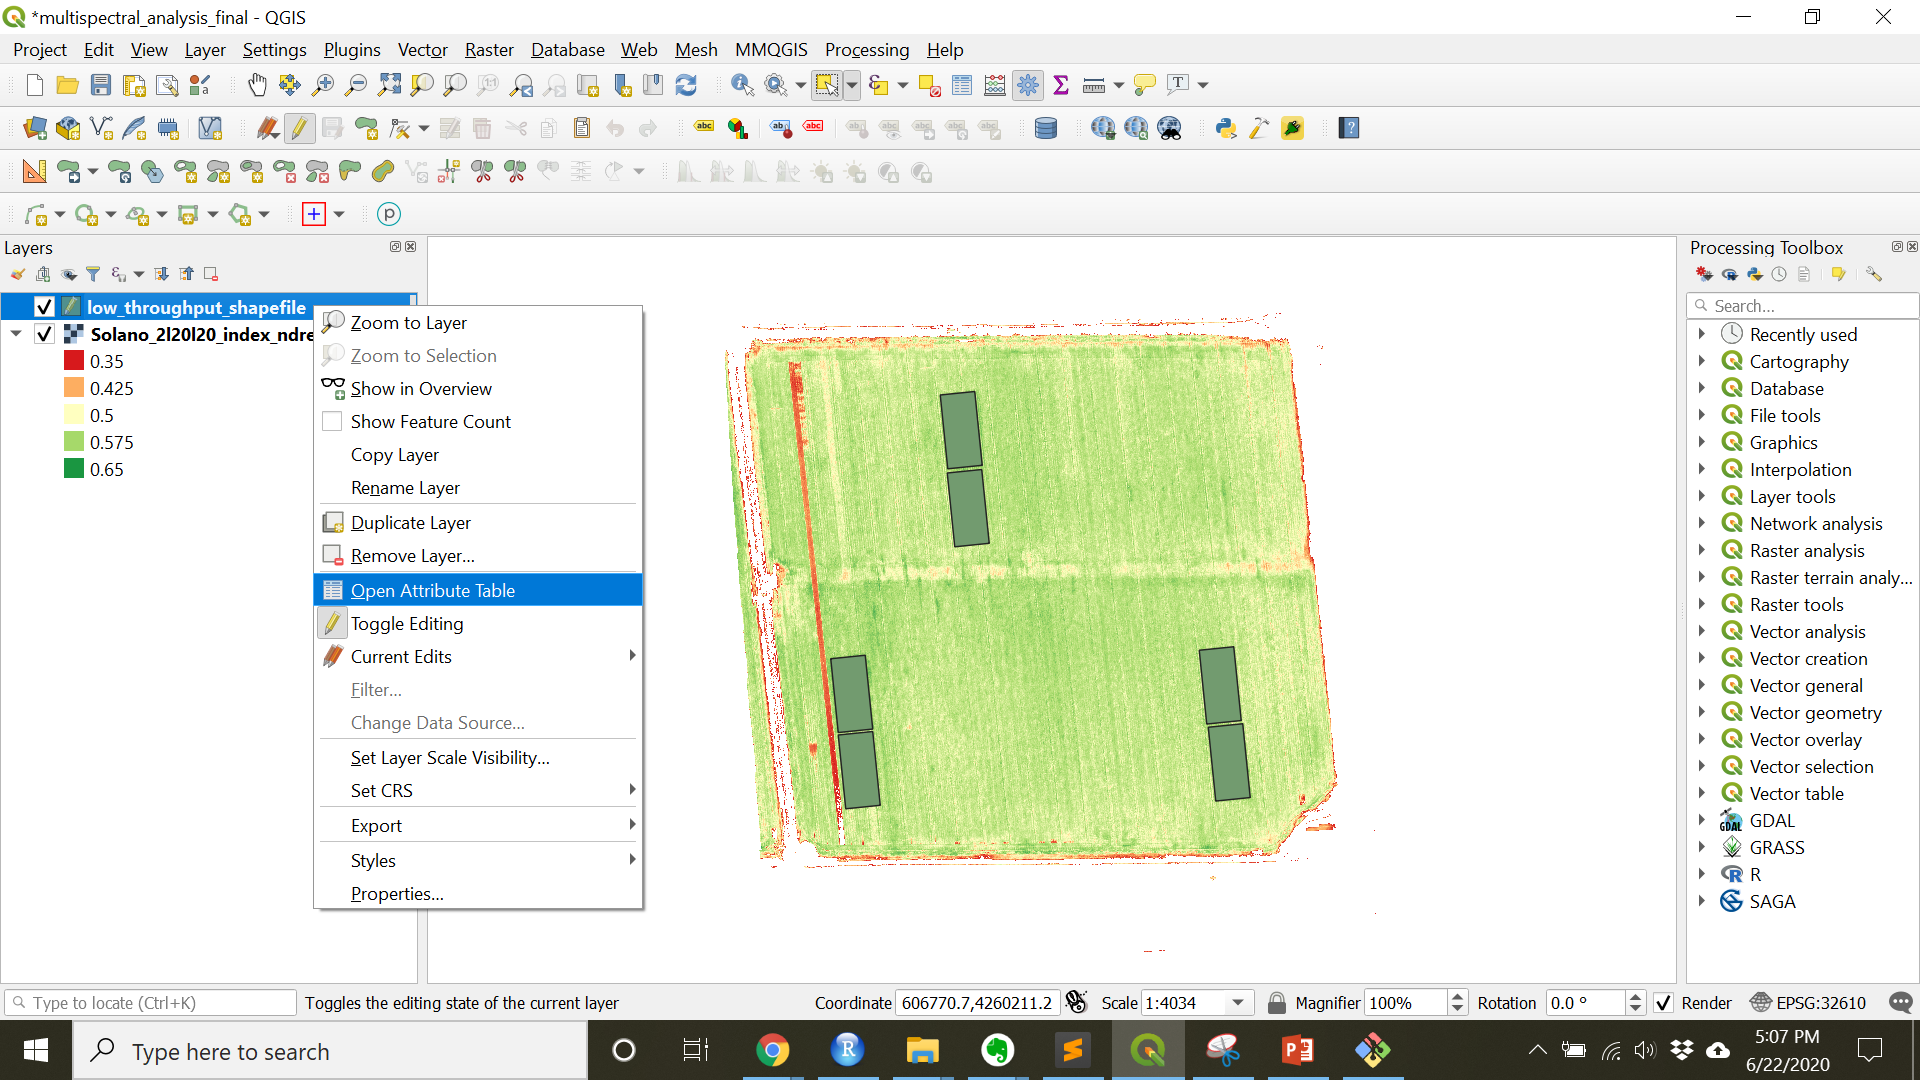
- Click the yellow
New Fieldbutton to create a new field. (Ctrl + W)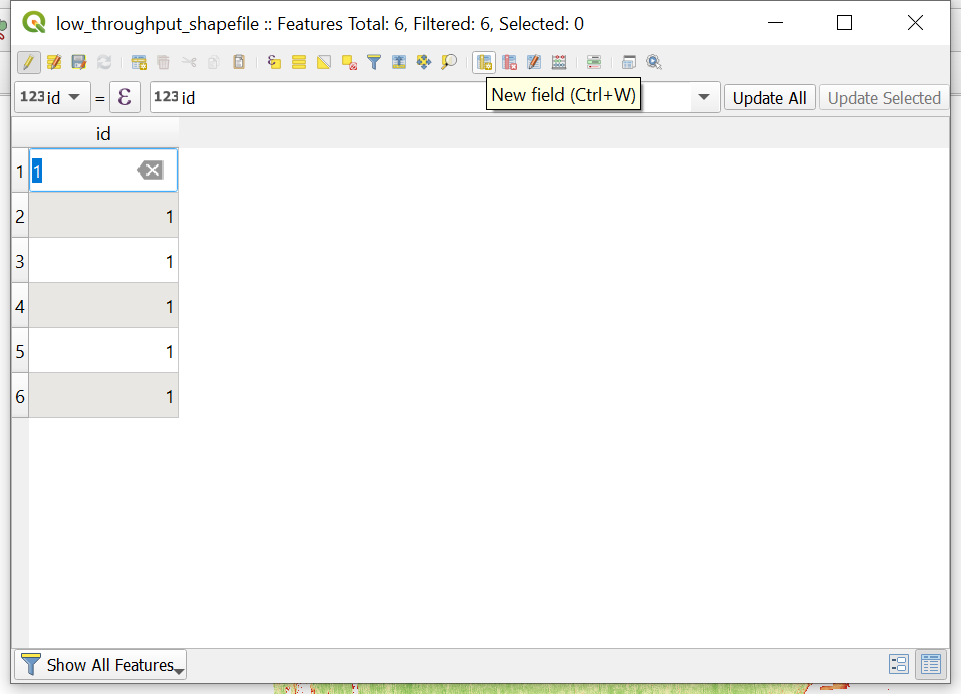
- Name the field appropriately and populate with metadata
- Pay attention to the
TypeandLengthfields as they determine what kind of variable will be in that column and the length limits for that variable.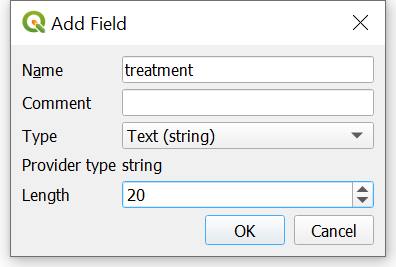
- Pay attention to the
- When all the metadata is populated, toggle editing off by clicking the yellow pencil and saving the changes when prompted
Check-in
If the
Processing Toolboxis not visible turn it on by navigating toView»Panels»Processing Toolbox
5. Zonal statistics
Zonal statics is like using the shapefile just created as a cookie cutter for the image. It ‘cuts’ the area below the shapefile and then summarizes it with different functions (mean, median, max, etc).
- Open the
Zonal Statisticstool underRaster Analysisin theProcessing Toolbox - Double click
Zonal Statisticsto open theZonal Statisticstool. - Set the Raster layer to the image of the field
- Choose the shapefile layer that was just created under
Vector layer containing zones - Set the prefix to the band or index you are extracting (in order to keep track of your data) under
Output column prefix(in this case ndre_) - Click
...and check whichever boxes of statistics you want to calculate. - Click
Runto run the algorithm. This will create a new layer with the selected statistics fields.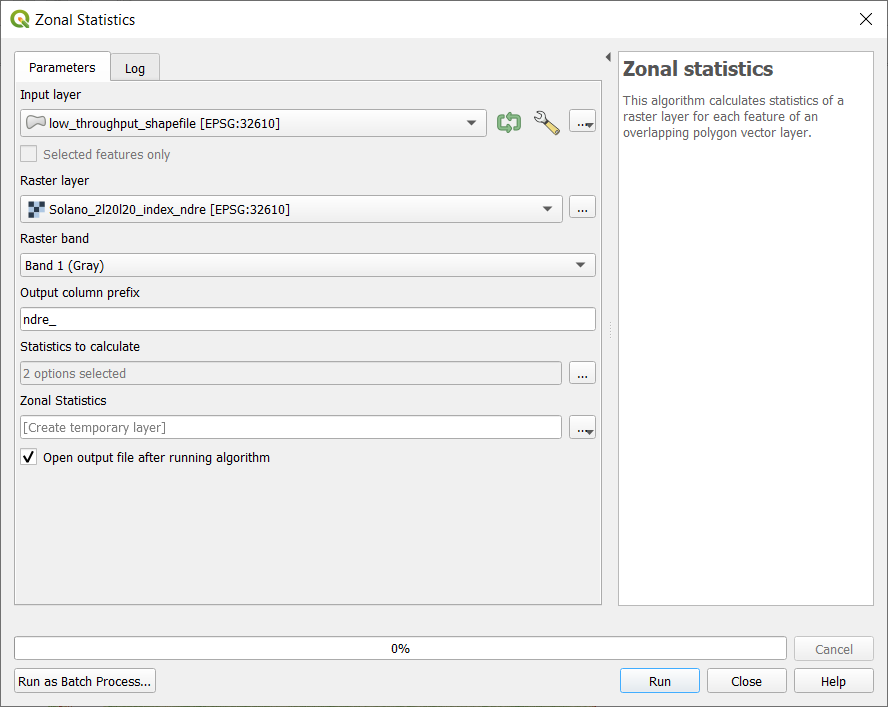
- Close the
Zonal Statisticstool. - Look at the values that were just extracted by clicking on the new ‘Zonal Statistics’ layer and navigating to
Open Attribute Table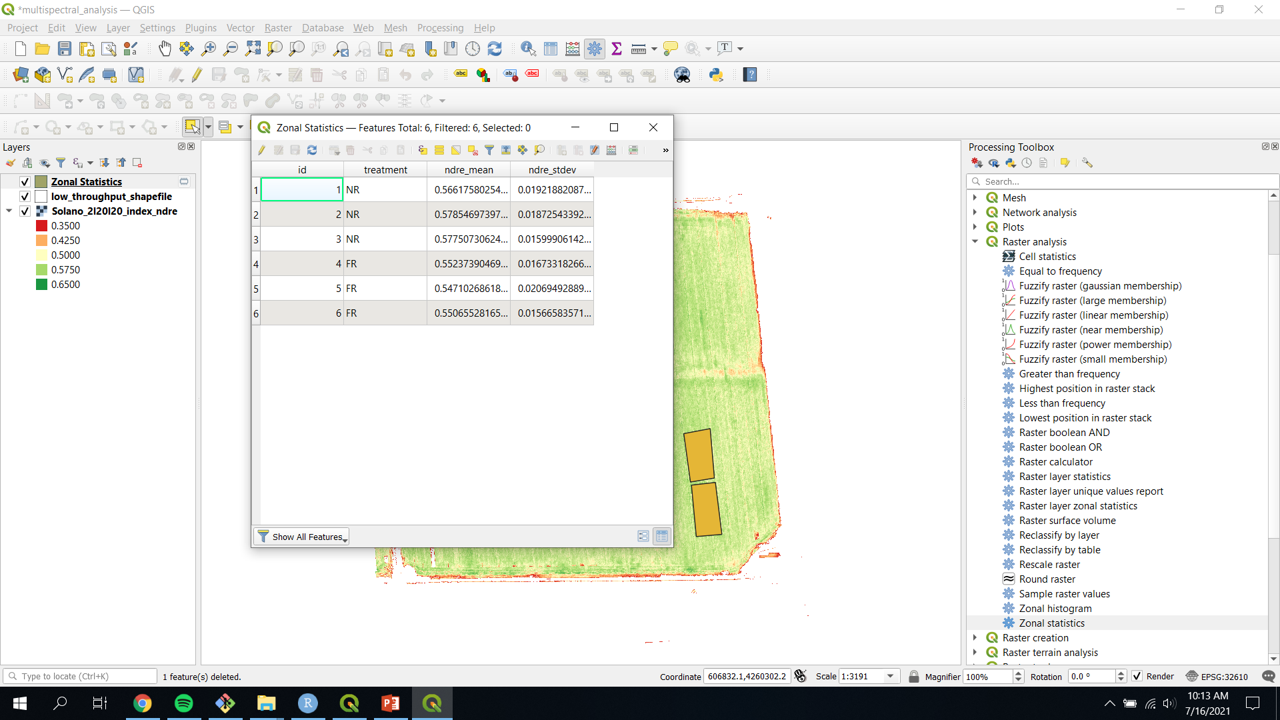
- The attribute table should contain values for each of the polygons created and each statistic that was checked in the
Zonal Statisticstool.
6. Export as csv
- Right click the ‘Zonal Statistics’ layer
- Navigate to
Export»Save Feature As…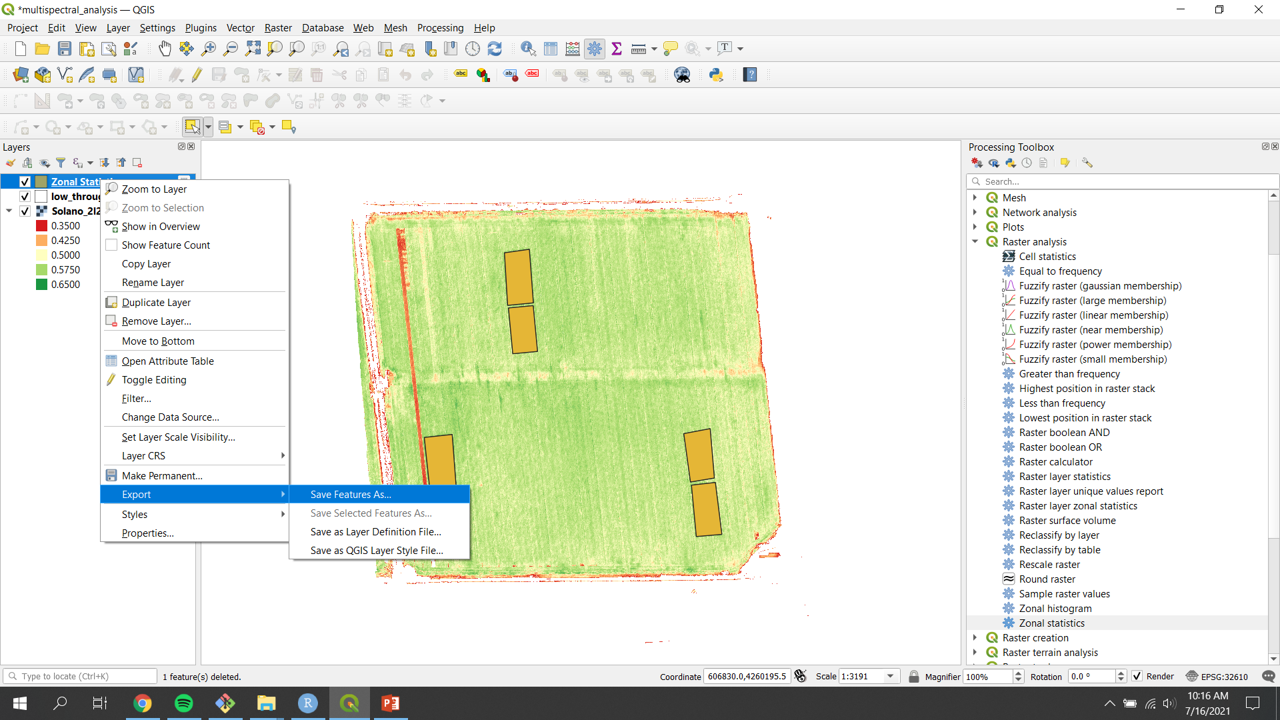
- Change the Format to
Comma Separate Value [CSV] - Name and save the file in a folder on your computer
- All other defaults are fine to leave
- Press
OKwhen everything is set to output and save the CSV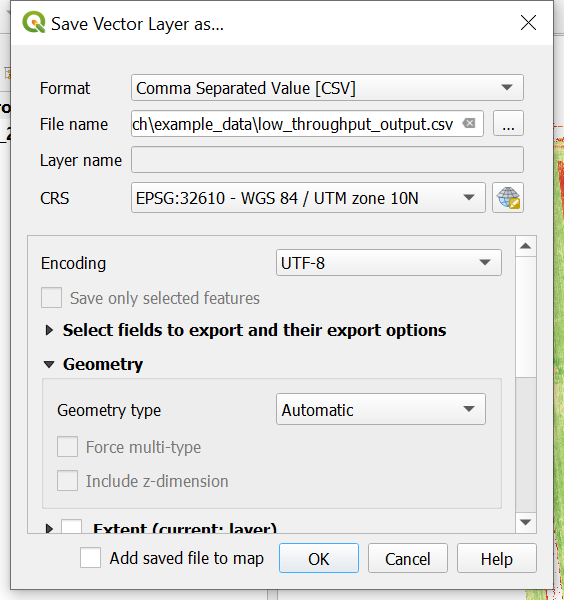
Now the drone data can be analyze in programs such as Excel or R. Models can be made. ANOVAs can be run. There are many more things that can be done with both the data values as well as the images.
Now you are ready to move on to Multispectral Data Extraction (High throughput)!