Drone-Data-in-Agricultural-Research
Multispectral Data Extraction (High throughput)
This lesson builds on the content in Multispectral Data Extraction (Low throughput).
Learning Objectives
- Create a shapefile with R script (for high throughput)
- Use a shapefile layer to extract data from a raster image
Often in a research setting there are many uniform experimental units that are being measured. This example show how to create and extract data from a uniform set of experimental plots - in this case of wheat and triticale - with an R script in QGIS.
0. R packages
For this section to work, make sure you have the geosphere, rgdal, raster, and rgeos packages installed in R. - For ease of access, open the package_install.R file in the Drone-Data-in_Agricultural-Research-data/R-scripts folder - Run the entire script by pressing the run button at the top (Ctrl + Shift + Enter)
Note that if you have run R in QGIS before you will have to update the packages in QGIS as well as R when there are new versions of the packages.
1. Setup new raster layer
- Add the raster layer Davis_4l10l18_index_grvi.tif in the downloaded Drone-Data-in_Agricultural-Research-data/example_data to the project. For a refresher see Adding Raster Layers in Multispectral Data Visualization
- Zoom to the newly added layer.
2. Create a shapefile to set the origin points of your trial.
This is used to calculate the angle the field is at the distance the plots are from each other.
- Create a new layer by choosing:
Layer»Create Layer»New Shapefile Layer… - Click
...to name and save the file to a folder - Choose
Pointas the geometry - Click
OKto create the blank shapefile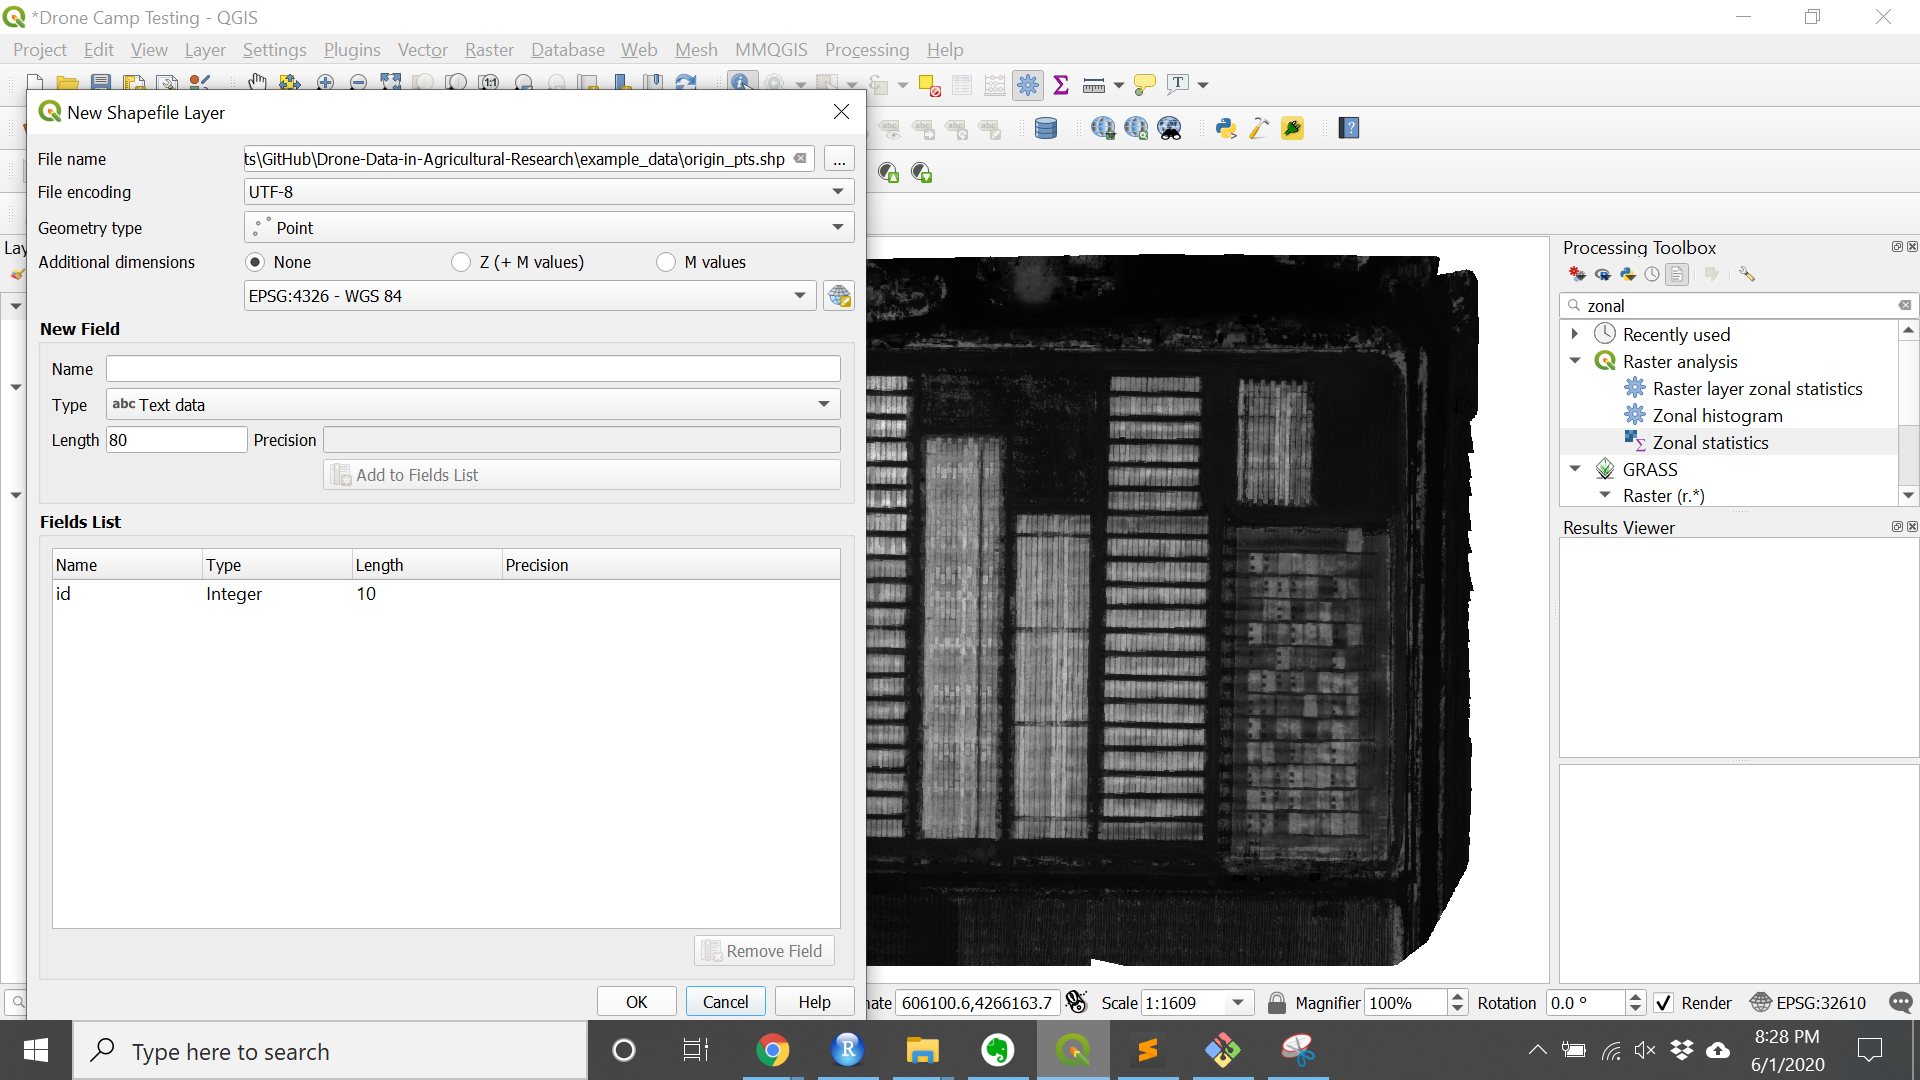
3. Set the origin points.
- Toggle editing on the shapefile just created.
- Choose the
Add Point Featuretool (Ctrl + .)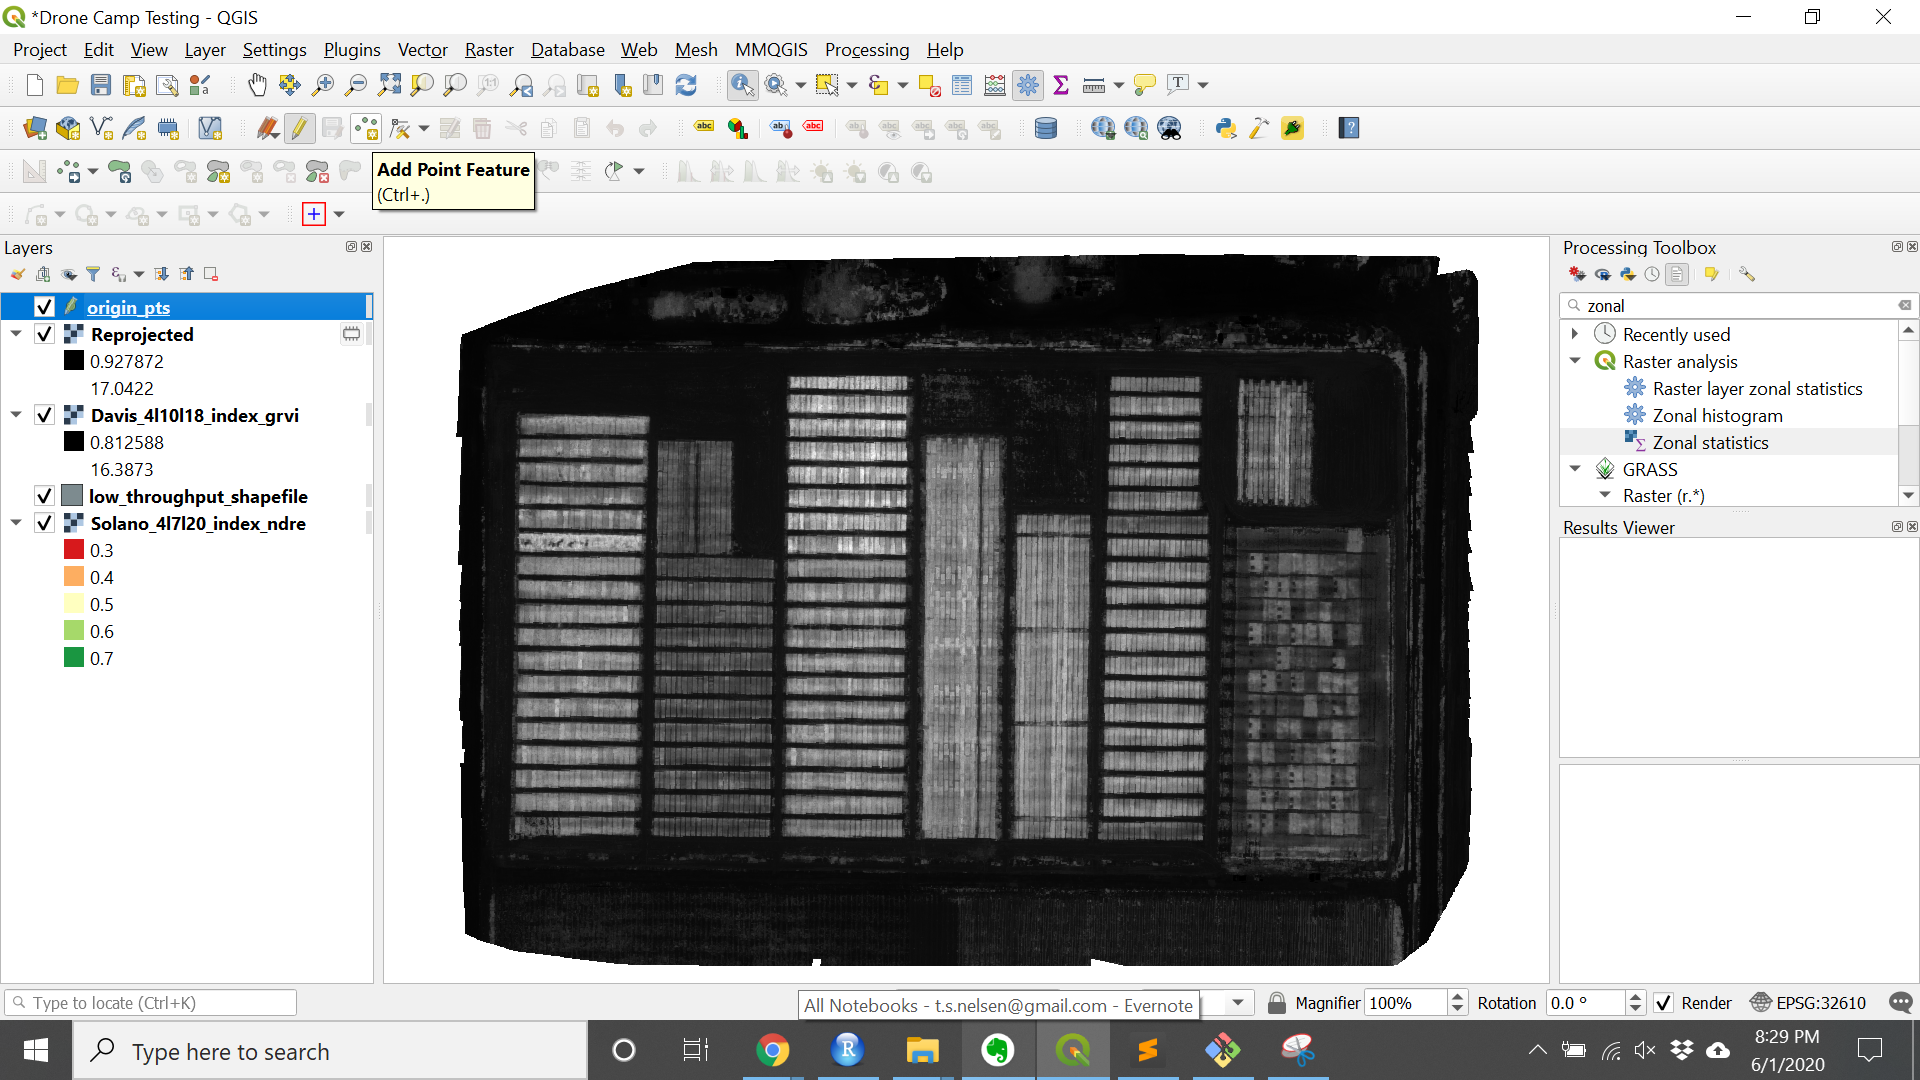
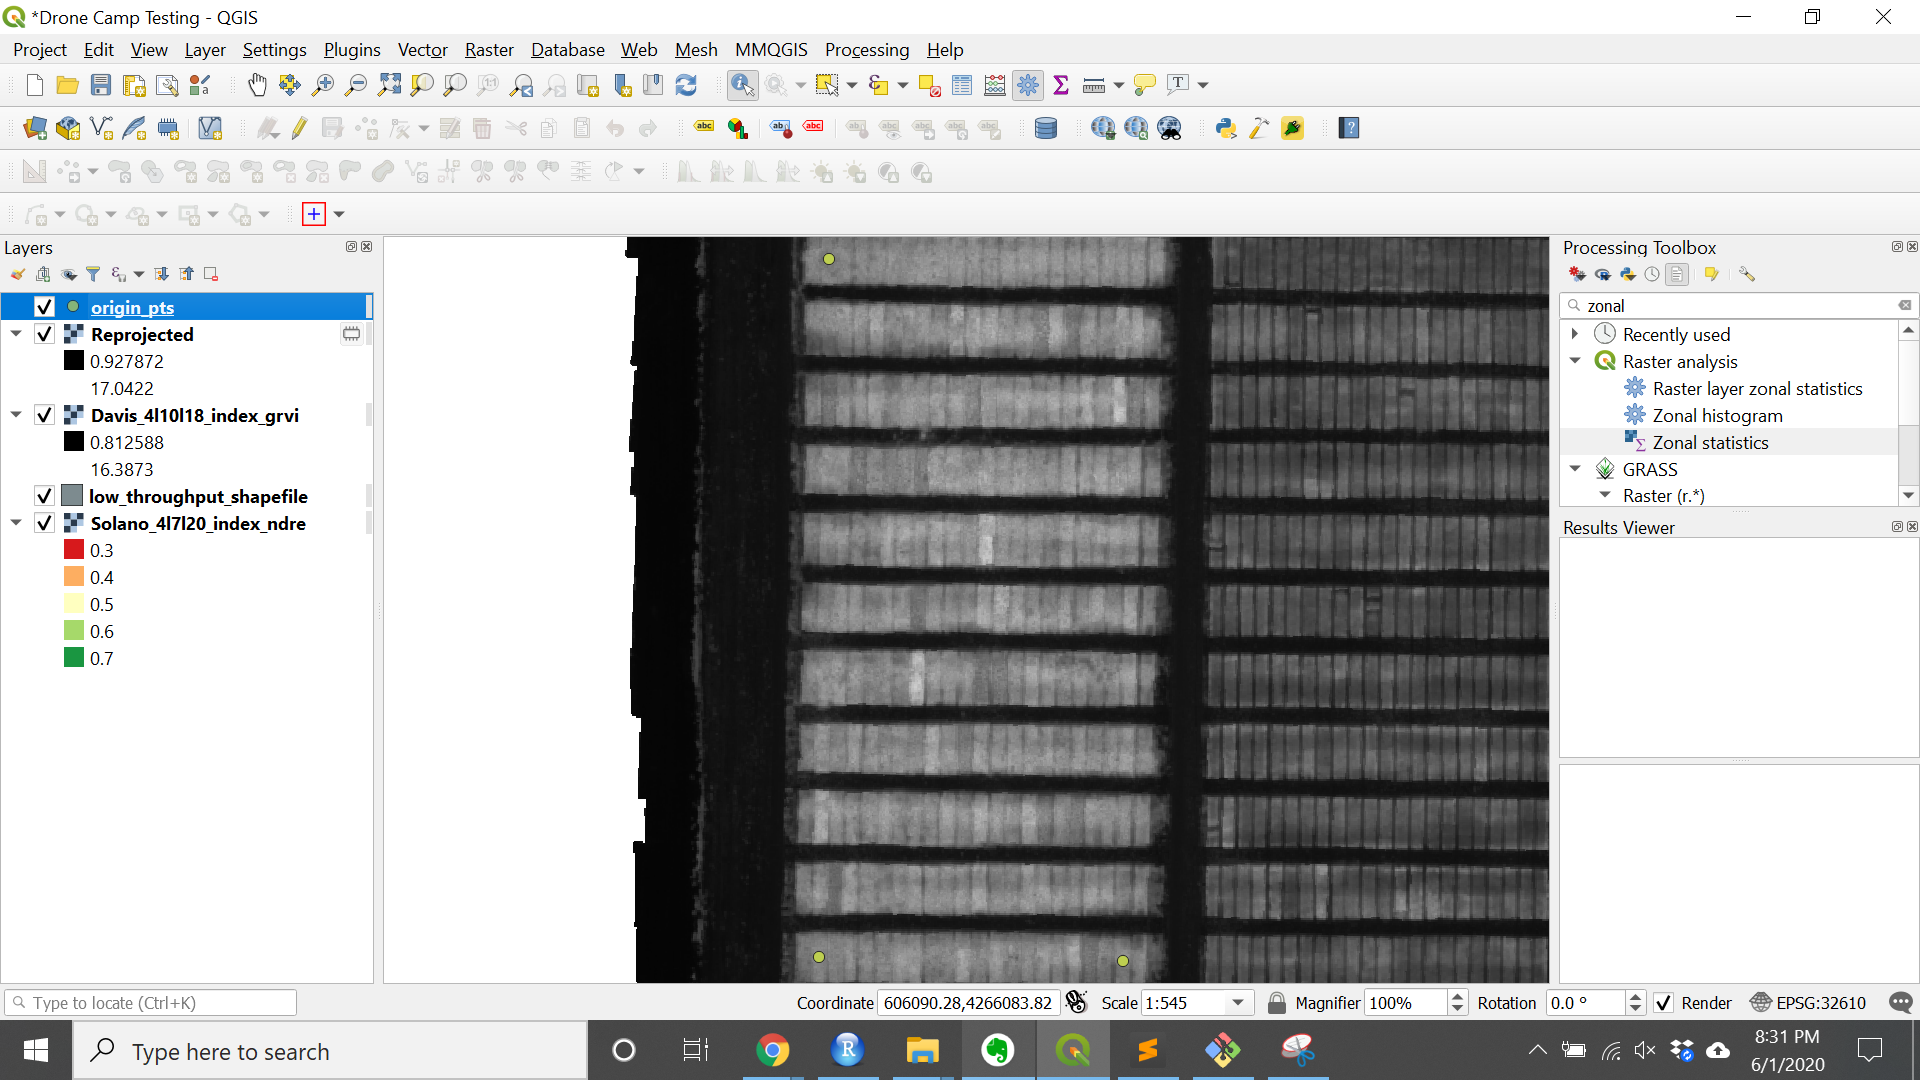
- Add 3 points as follows:
- plot 101 (the bottom left corner of your trial) should have id = 1
- the bottom right corner should have id = 2
- the top left corner should have id = 3
- Do not include fill rows or data you do not want to extract
- Toggle editing off to save
4. Check that the “Processing R” plugin is installed
- Navigate to:
Plugins»Manage and Install Plugins… - Finds
Processing R Providerby scrolling or searching - Click the plugin and press
Install pluginif the plugin is not already installed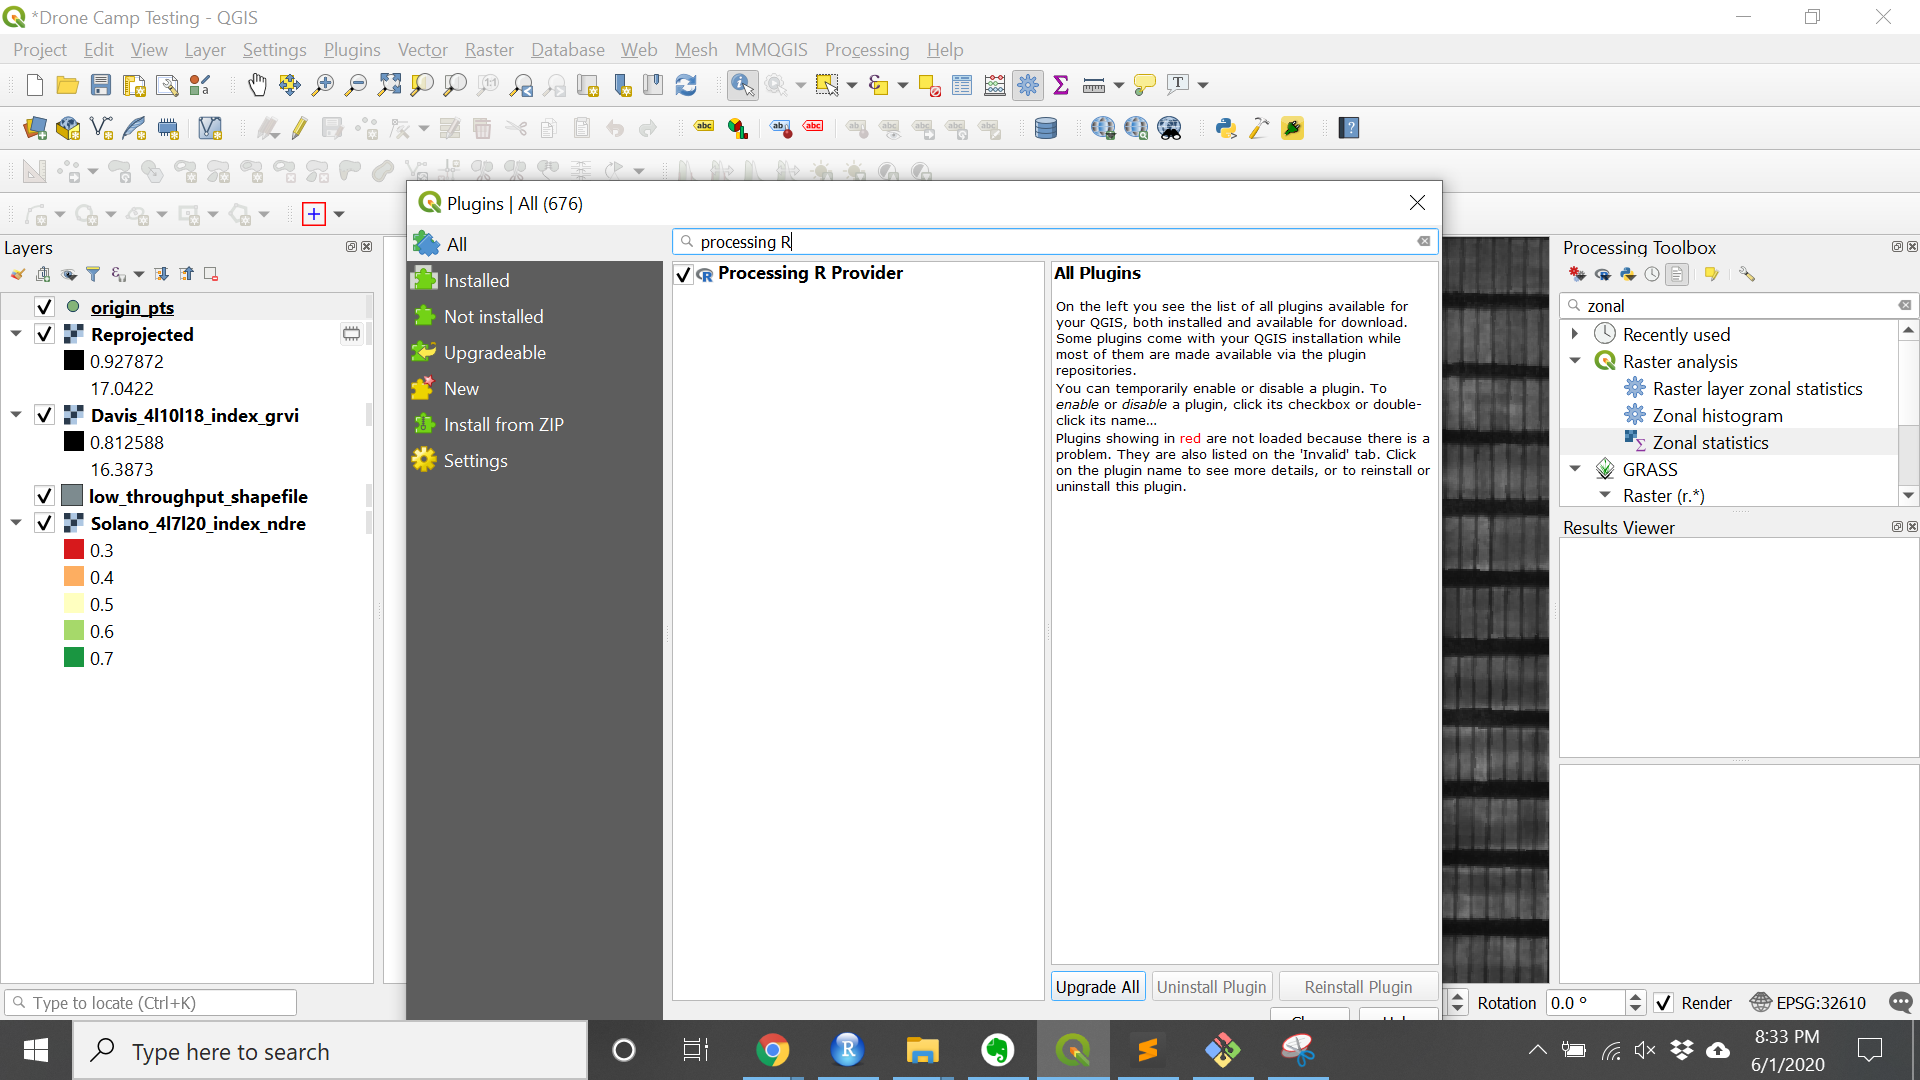
Note that the first time the plugin is downloaded it is a good idea to restart QGIS to make sure that it is loaded fully.
5. Open an R script in QGIS
- Click the R icon and
Create New R Script...in theProcessing Toolbox - Open the small_plot_trial_extraction_0.0.4.rsx file in the downloaded Drone-Data-in_Agricultural-Research-data/R_scripts
- Click
Save As..to save the script into the “QGIS3\profiles\default\processing\rscripts” folder so that the script can always be used in QGIS3 (otherwise click the play button to execute)
6. Run an R script in QGIS
- Open the script by right clicking the small_plot_trial_extraction_0.0.4 under the R icon in the
Processing Toolbox - Choose
Execute... - Set the
Originto the origin point shapefile - Set the correct number of rows and ranges (the default for both is 10 but in this case there are 20 rows and 10 ranges)
- A row is defined as where the planter drives down while a range is perpendicular to the row.
- Set the width and length of the plots in feet. If no width and/or length is entered the default is 60% of the distance between plots.
- The default is for rectangular plots but if you want circular plots uncheck the check-box next to rectangular
- Click
Run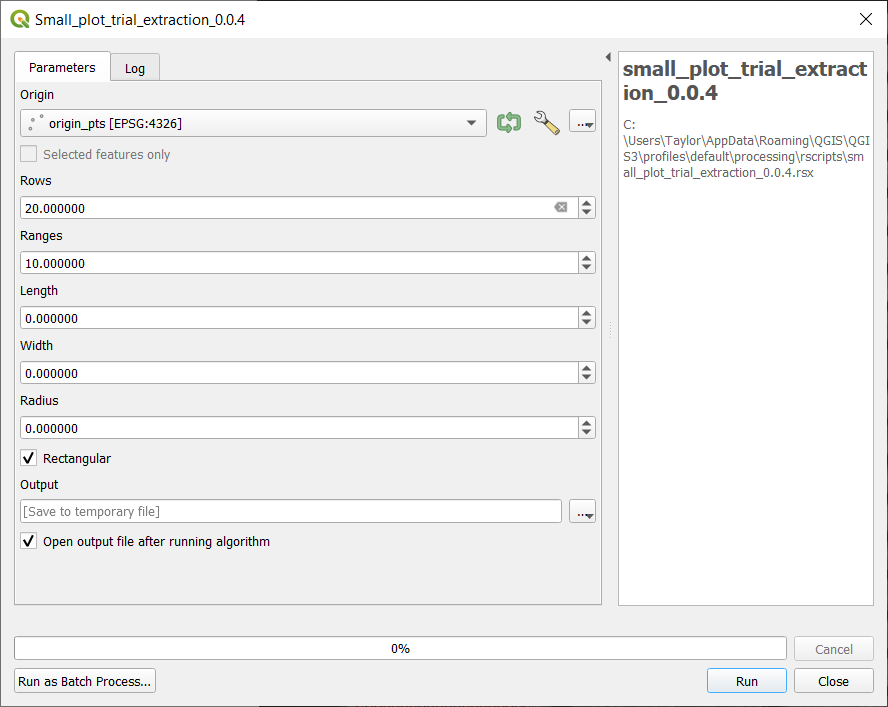
- Close the window when the algorithm is finished processing.
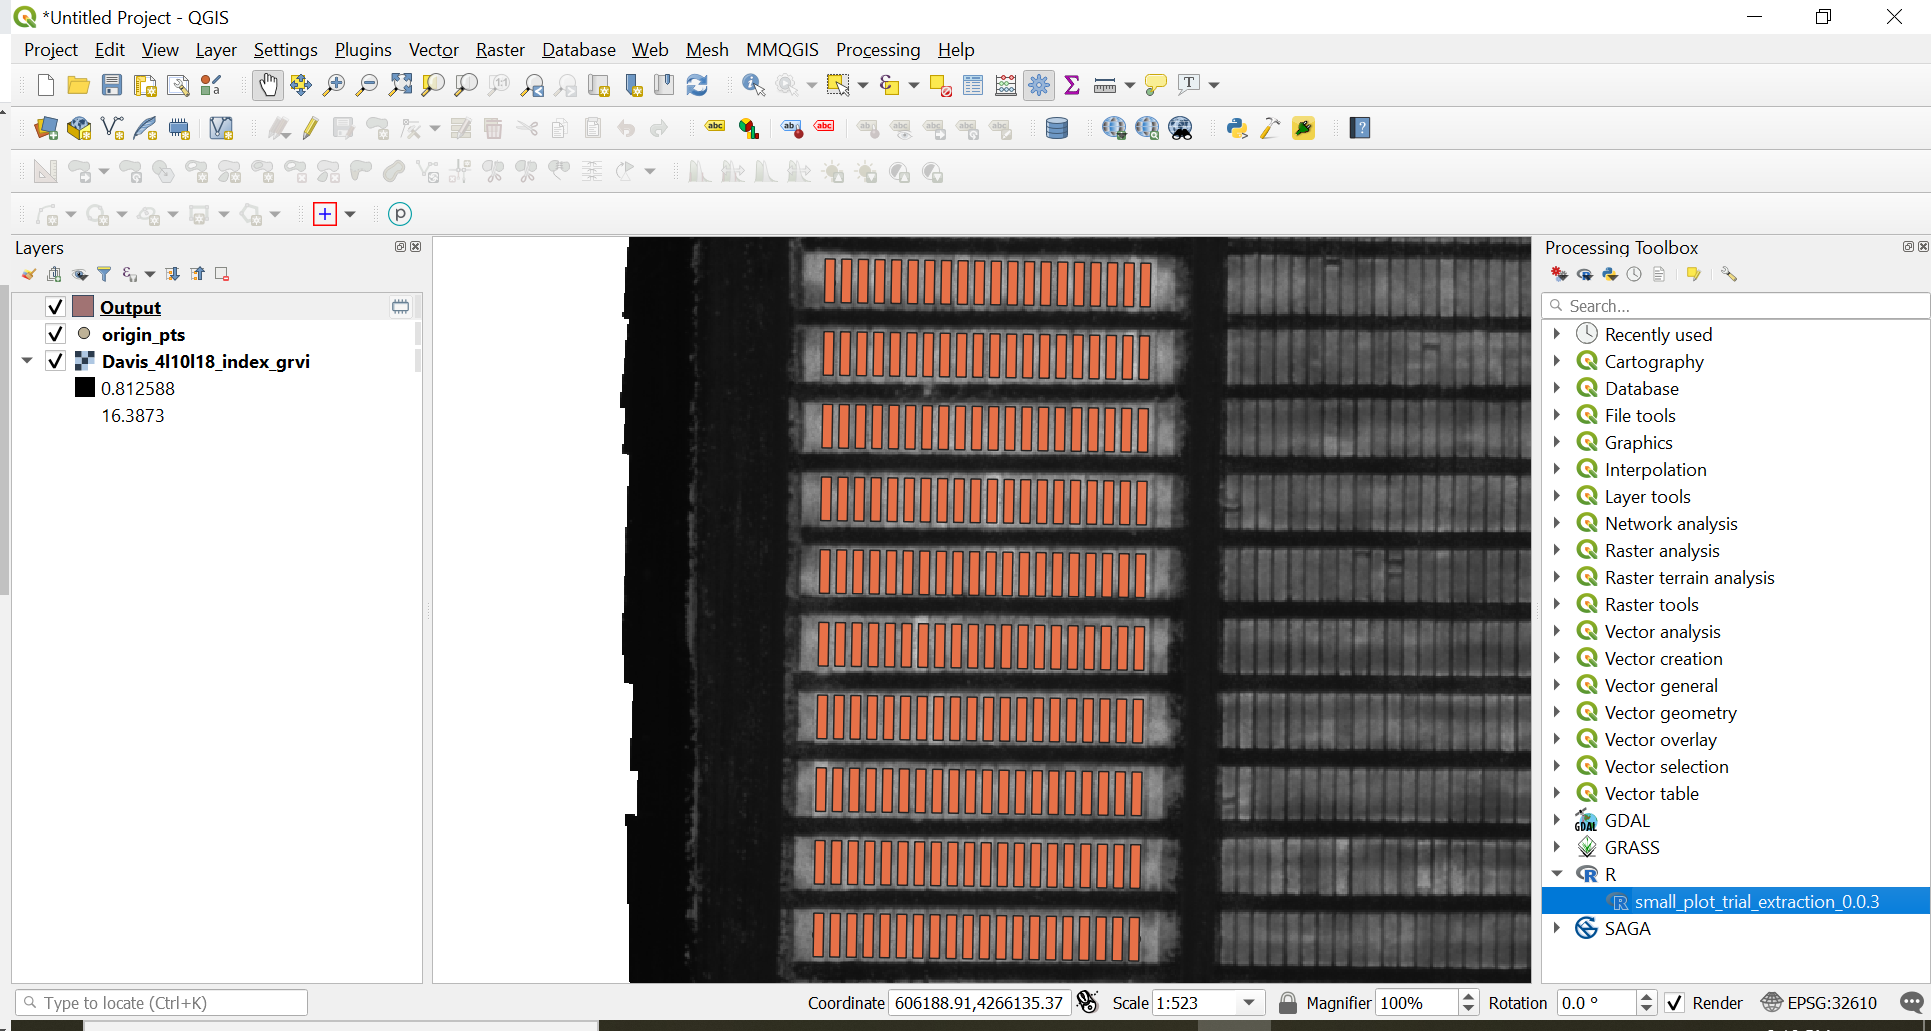
Check-in
The shapefile output should look something like the image below.
8. Save the shapefile
- Right click the Output layer that was created then
Export>Save Feature As… - Choose
ESRI Shapefileas the output format - Fill out the file name and folder location. Check to make sure the CRS is correct.
9. Adjust the Shapefile
In some cases the shapefile will need to be adjusted to make sure that it is accurately within all the plots.
For more information about editing a shapefile see Edit the shapefile in Multispectral Data Extraction
10. Run Zonal Statistic
For step-by-step instructions on the Zonal Statistics tool see Zonal Statistics in Multispectral Data Extraction
11. Export the data as a CSV.
For detailed instructions on how to export a shapefile with data to a csv file see Export as csv in Multispectral Data Extraction
This is the end of the lessons so far! Please reach out if you have questions, comments or suggestions.